


Dashboard structure
Tabs
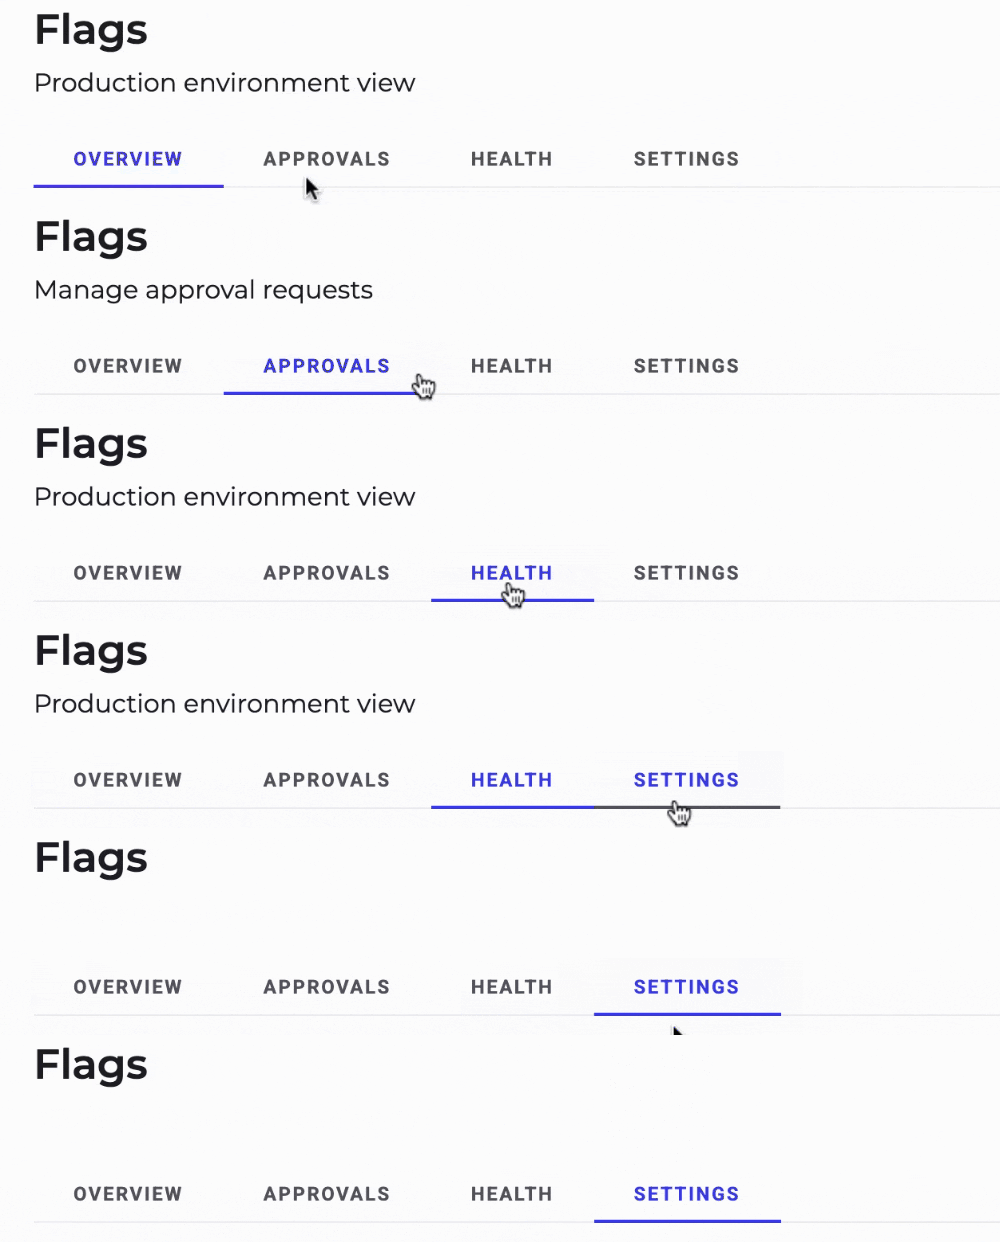
- Overview: The standard view, which lets you navigate your flags and their rules.
- Approvals: Lists flags or rules waiting for approval before rollout.
- Health: Displays flag health, last evaluation, and last modification to better manage technical debt.
- Settings: Access to approval and holdout settings. You can access holdout reporting from this tab.
Environment selector and views
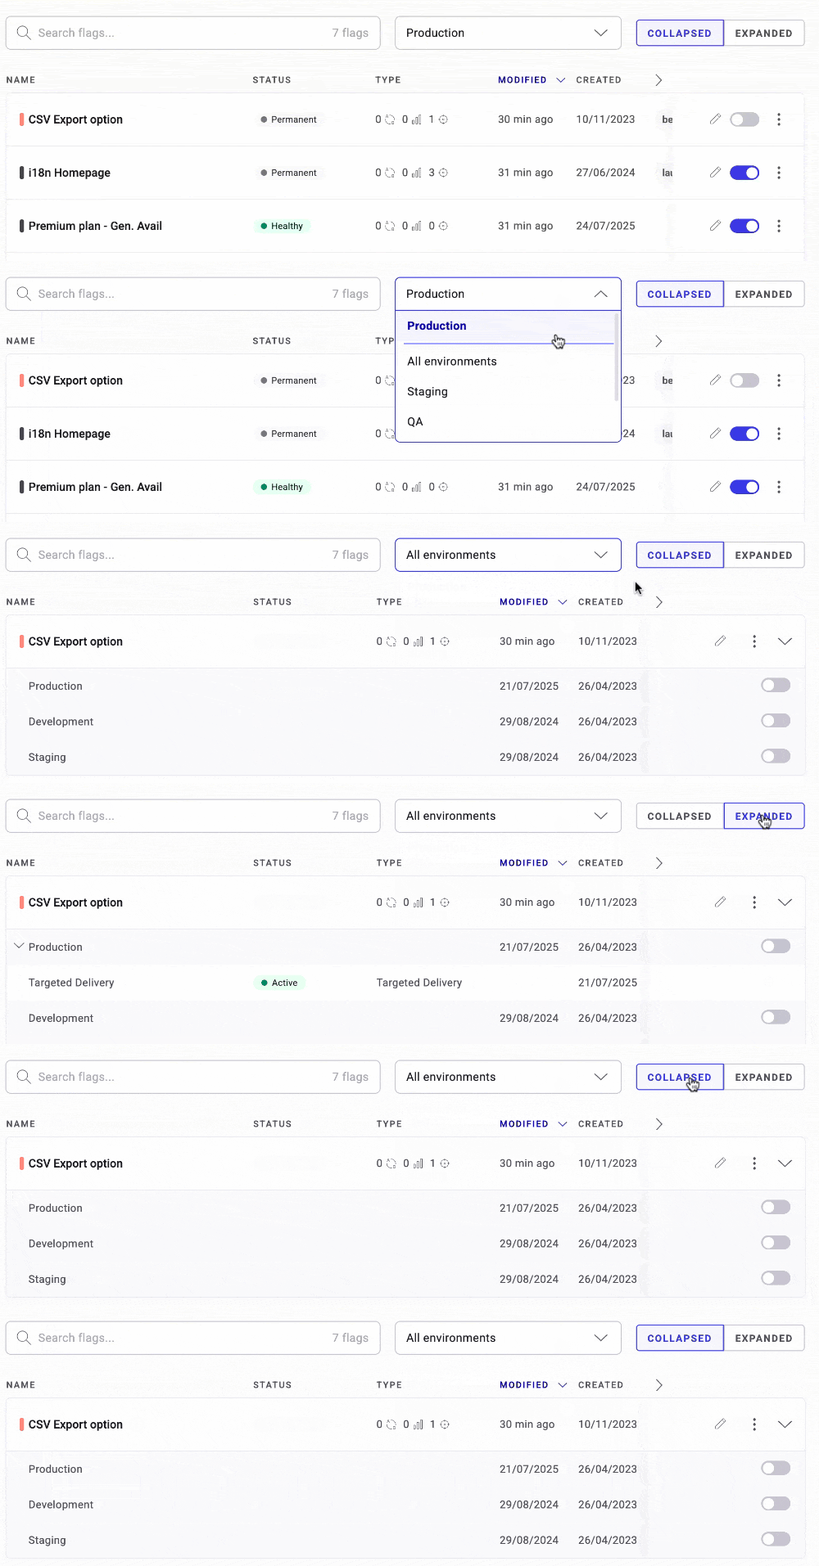
- Collapsed: Compact list of all flags, similar to the previous dashboard.
- Expanded: Shows details at a rule level for a more complete picture of the rollouts and experiments in your flag’s environments.
Flag actions

- Toggle a flag On or Off.
- Open the flag configuration using the edit icon.
- Click the edit or results icon at the end of a rule’s row to open its configuration or reporting page.