

Export
Click Export to access available export options. You can choose:- The export format
- The type of data to export
- To only export specific metrics, goals, or variations
XLSX export
The XLSX export option allows you to download your experiment results in a structured Excel spreadsheet format. This format includes multiple tabs that organize different aspects of your results. When you choose XLSX export:- You get a detailed overview with pre-formatted tables.
- The structure is more user-friendly and suited for manual review or presentation.
Data to export
Type of data to export
You have several options to manage what data you export to the XLSX report.- Visit based: Display data based on total number of visits.
- Visitor based: Display data based on total number of unique visitors.
- View per goal: Export data based on goals.
- View per variation: Export data based on variations.
- Only export specific metrics: Toggle the switch on and select or deselect which metrics you’d like to include/exclude from your export.
- Only export specific goals: Toggle the switch on and select or deselect which goals you’d like to include/exclude from your export.
- Only export specific variations: Toggle the switch on and select or deselect which variations you’d like to include/exclude from your export.
CSV export
CSV offers a raw, simplified format. It’s particularly useful for custom analysis or if you plan to import the data into another analytics tool. However, there are a few key points to note:- CSV exports raw data. Unlike the XLSX export, which organizes and formats data for easy viewing, the CSV export offers unprocessed data that’s ideal for deeper technical analysis.
- The unit of export limits what you can include: depending on your selection, your export may cover only certain data points.
- Available options will change based on the export format. For example, filters and breakdowns are available in XLSX but not CSV. Instead, CSV exports will account for any filters you applied on the Results page.
- Because CSV files are more minimal, they provide more flexibility for scripting or automated workflows.
If you’ve set up metadata for a goal, it will automatically appear as a column in the raw export. This column contains a list of metadata values sent for each conversion.
Additional data
Select CSV export as your export format to reveal the Additional data section. Kameleoon hides this section when you select XLSX export. Select or deselect the custom data that you want to include as additional columns in your CSV export.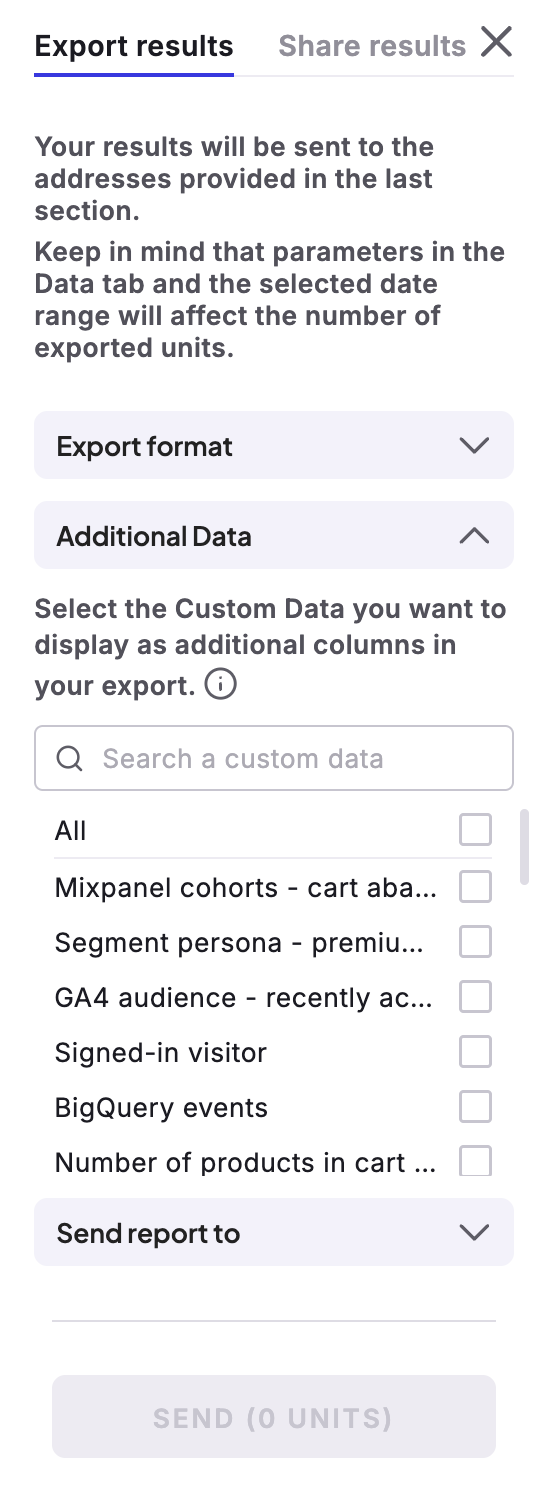
Send report to
Enter the recipient email addresses for the export. Separate multiple addresses with commas. By default, the platform limits exports to 1 million units per month. A unit corresponds to a single visit or visitor. To remove this cap, you must purchase the unlimited export add-on.Units
Displays how many export units you have available. Send shows the total unit cost of your export in parentheses. If you want unlimited units, you must request an upgrade. To do so, click Ask for an upgrade > Send upgrade request.Additional actions
Click the three-dots menu to access additional actions available on the Results page.
Share
Click Share to access sharing options for your campaign’s results. In the Share results tab, click Copy link to copy a shareable link to your results.Simulate
Click Simulate to open a simulation of your experiment in a new tab.Analyze with Kai
Click Analyze with Kai to open Kai, Kameleoon’s AI assistant, for your experiment. Ask Kai questions about your experiment’s results, or ask it to act directly on your experiment, such as updating targeting or creating a feature flag, using the same MCP server tools available to IDE integrations.Alerts
Click Manage alerts to access the Alerts menu.Kameleoon checks for alert conditions on a schedule (typically every hour) rather than immediately as they occur. When a check confirms your criteria, Kameleoon triggers the alert and sends it to the receivers.
Edit settings
Type a receiver’s email address and press Enter. Click the X icon to delete an address from your receivers. Click the dropdown menu to access the available languages (English, French, and German). Click a language to select it. Click Save to save your settings.Add an alert
Click Create an alert to access the Add an alert menu. You have three alert types to choose from:- Results are usable: The primary goal’s results have been consistent over the past 5 days, indicating the results are reliable.
- A variation is winning: A variation is reliable and has the highest conversion rate for the main goal.
- A condition is reached: You can create personalized criteria that, when met, will trigger an alert.
A condition is reached
If you click A condition is reached > Next, you must define the alert’s criteria. You have several conditions to choose from. To set an alert for a condition:- Select a condition from the list.
- Set the comparison logic (is higher than or is lower than) and enter the corresponding numerical value.
- Select the goals or variations on which to track the condition.
- Click Save.
Active alerts
Once you’ve created an alert, it will appear in the Alerts menu. Untriggered alerts appear in the Pending tab, and triggered alerts appear in the Completed tab. Hover over the i icon to access alert details. Click the three-dots menu to Edit or Delete an alert.Experiment configuration
Click Experiment configuration to access important details about your experiment.
- Description
- Traffic distribution
- Goals
- Targeting
- Reporting tools
- Minimum reliability
- Attribution window
Open in the editor
The button’s label and destination depend on your experiment’s type:- Graphic experiments: Click Open in the graphic editor to open your experiment in the Graphic editor.
- Code experiments: Click Open in the code editor to open your experiment in the Code editor.
- Prompt-Based Experiments (PBX): Click Edit in PBX to open your experiment in the PBX editor.
Refresh data
Click Refresh data to refresh the page and retrieve your experiment’s current data.Pause data collection
Click Pause data collection > Pause data to stop collecting data for your experiment. You must manually restart data collection in your experiment. However, you still have access to previously collected data during the pause. To restart data collection, click Start data collection > Restart data.Reset data
Resetting data is a purely visual operation that erases all results from the campaign’s reporting interface. Kameleoon doesn’t permanently delete the underlying data. It only hides the data from view starting from the reset date. Resetting a campaign lets you restart the experiment, clearing all previously collected results. However, it doesn’t affect user bucketing: visitors who saw a variation before continue to see the same one when they return. If you want to re-randomize visitors, you must also reallocate traffic or create a new experiment. To reset your experiment’s data:- Click Reset data.
- Type RESET into the text field when prompted.
- Click Reset data.
This action doesn’t reset the attribution window. Because these visitors saw a variation in the past, Kameleoon still considers their influenced sessions in your visitor-level results.