

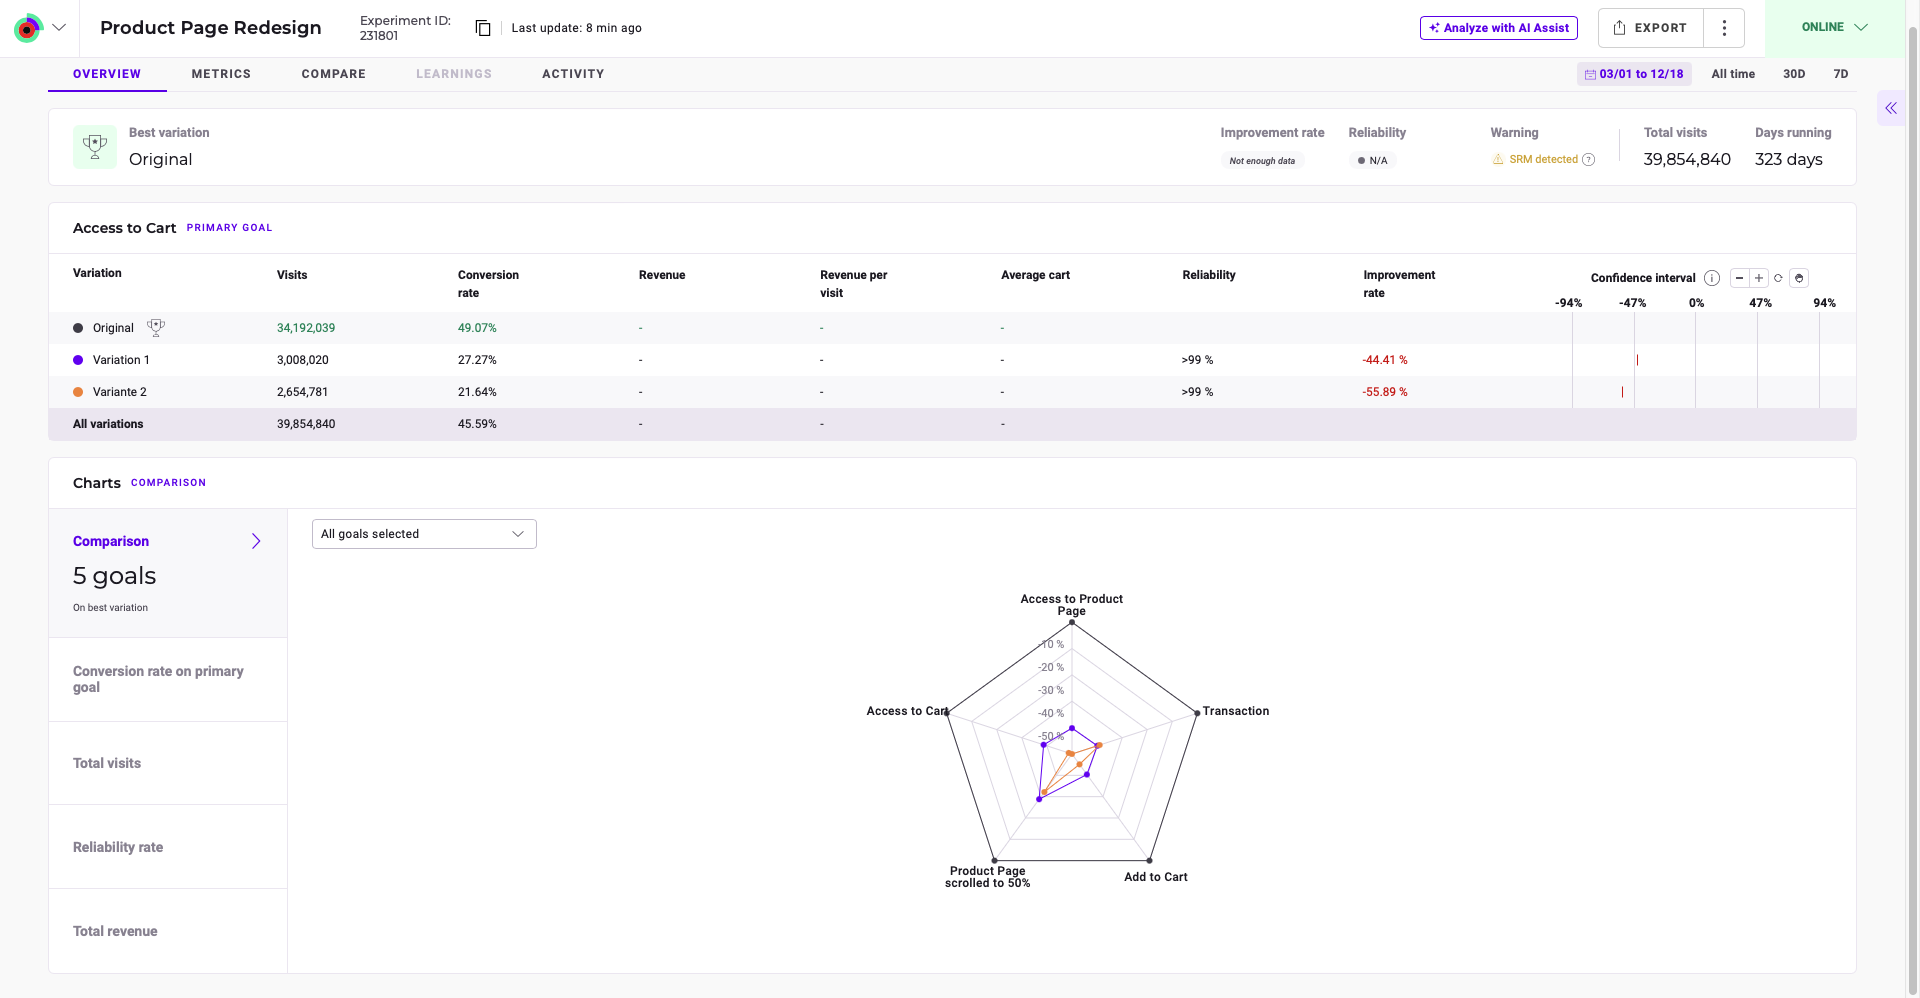
Winning variation

- The recommended variation.
- The variation’s improvement rate.
- The variation’s reliability.
- The total number of visits in the selected time range.
- The experiment’s duration in days.
Primary goal
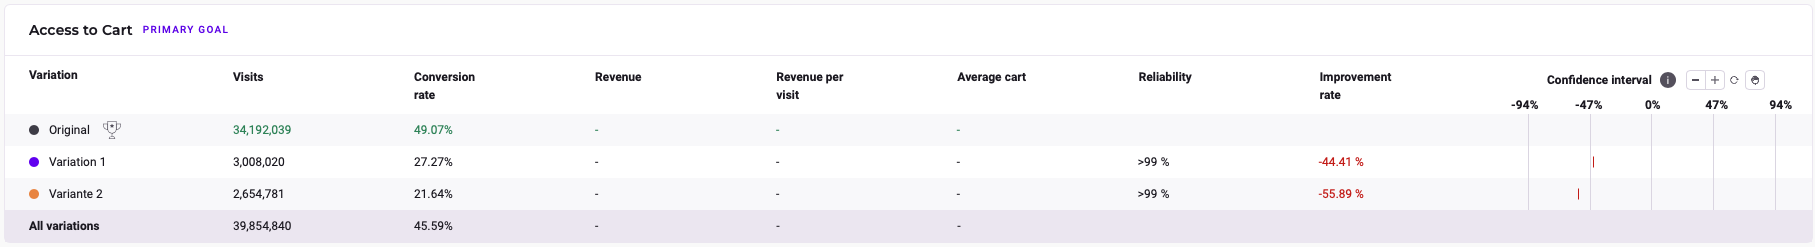
- Variation names
- Number of visits per variation
- Percentage of conversions per variation
- Revenue generated (for relevant goals)
- Average cart value (for relevant goals)
- Reliability score
- Improvement compared to the reference variation
Confidence interval
The confidence interval graph appears on the table’s far right. The confidence interval indicates the range within which a statistic’s actual value is likely to fall. The +/- represents each variations’ margin of error. Hover over a variation for a detailed breakdown.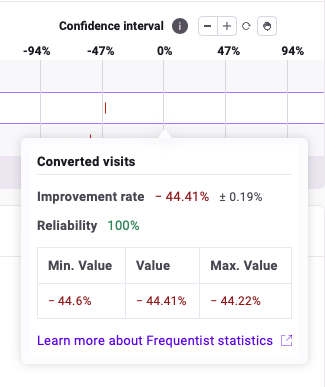
- The variation’s improvement rate, accompanied by its confidence interval.
- The variation’s reliability score.
- The variation’s minimum and maximum improvement rate.
- A link to learn more about Frequentist or Bayesian statistical methods (depending on your selection).
Graph controls
The confidence interval graph provides several manipulation tools:- Zoom in: Click +.
- Zoom out: Click -.
- Reset: Click the reset icon.
- Drag view: Select the hand icon, then click and drag the graph. Click the hand icon again to re-enable hover functionality.
Charts
Comparison
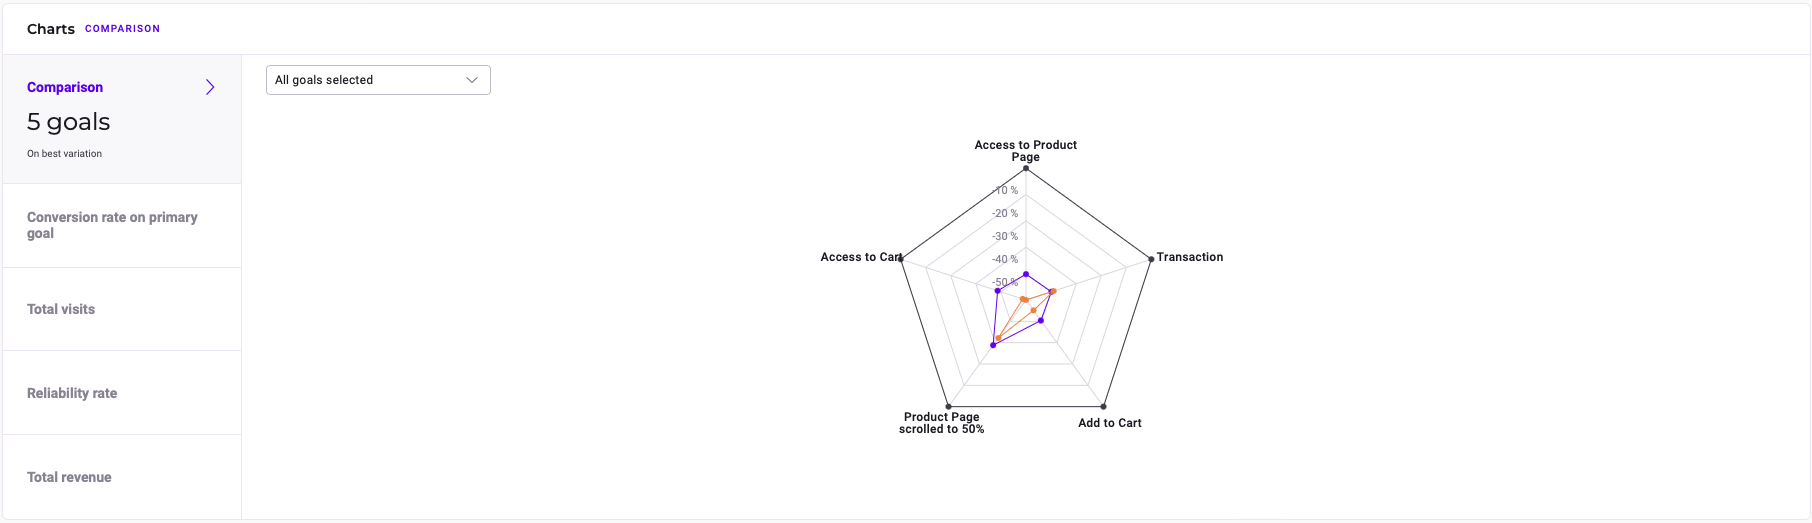
- Improvement rate
- Confidence interval
- Reliability score
- Click on the dropdown menu above the chart.
- Scroll to or search for your desired goal.
- Click the checkbox next to each goal’s name to toggle its visibility.
Conversion rate on primary goal
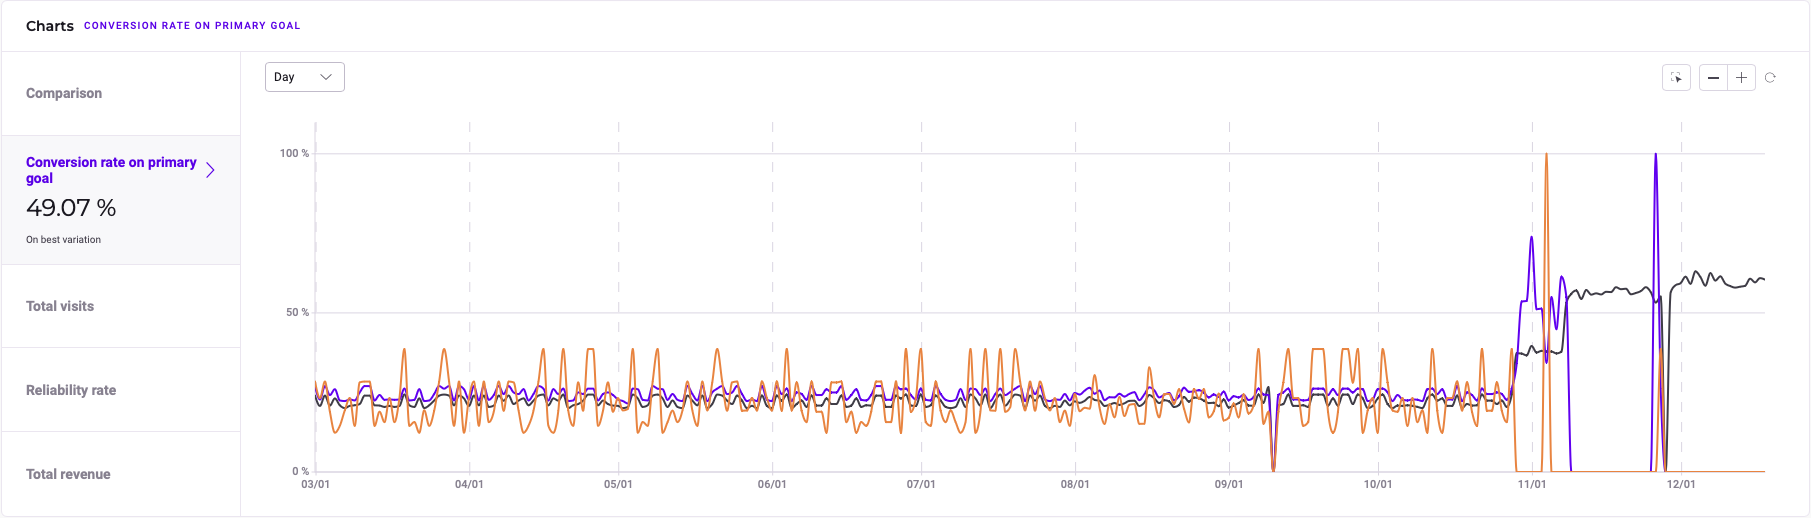
- The date corresponding to the data.
- Each variation’s conversion rate on that day.
Chart controls
The chart provides several tools to help you customize your view.Timescale
To adjust the timescale of the data to day, month, or year:- Click the dropdown menu above the chart.
- Select Day, Month, or Year.
Select area
To focus on a specific area of data:- Click the Select area icon.
- Click and drag over the chart to select the desired area.
- Click the checkmark to confirm your selection.
Zooming and resetting
- Click + to zoom in on the chart.
- Click - to zoom out.
- Click the Reset icon to reset your view of the chart.
Total visits
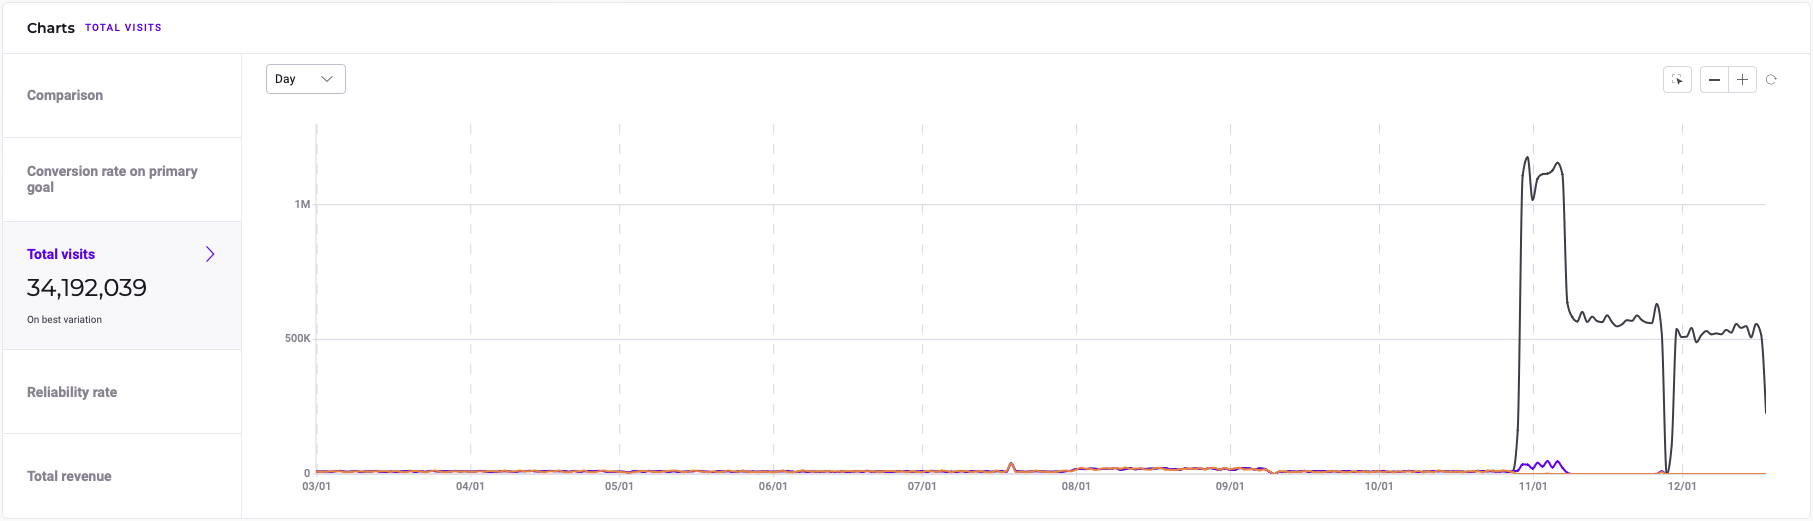
- The date associated with the data.
- The total number of visitors on the specified date.
Chart controls
The chart provides several tools to help you customize your view.Timescale
To adjust the timescale of the data to day, month, or year:- Click the dropdown menu above the chart.
- Select Day, Month, or Year.
Select area
To focus on a specific area of data:- Click the Select area icon.
- Click and drag over the chart to select the desired area.
- Click the checkmark to confirm your selection.
Zooming and resetting
- Click + to zoom in on the chart.
- Click - to zoom out.
- Click the Reset icon to reset your view of the chart.
Reliability rate
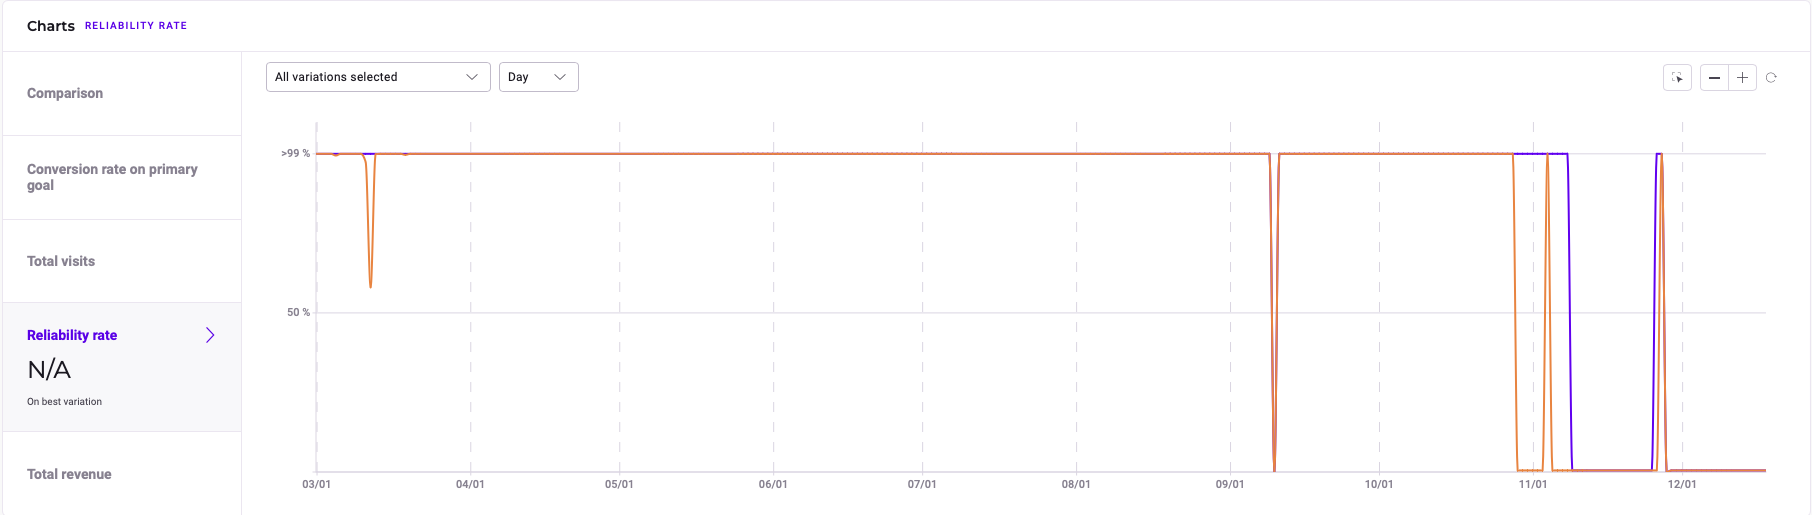
- The date associated with the data.
- The reliability rate on the specified date.
Chart controls
The chart provides several tools to help you customize your view.Variation selection
To show or hide a variation from the chart:- Click the dropdown menu above the chart on the left-hand side.
- Check the box next to a variation to show it, or uncheck the box to hide it.
Timescale
To adjust the timescale of the data to day, month, or year:- Click the dropdown menu above the chart.
- Select Day, Month, or Year.
Select area
To focus on a specific area of data:- Click the Select area icon.
- Click and drag over the chart to select the desired area.
- Click the checkmark to confirm your selection.
Zooming and resetting
- Click + to zoom in on the chart.
- Click - to zoom out.
- Click the Reset icon to reset your view of the chart.
Total revenue

The Total revenue graph only appears if your primary goal is a Revenue goal.
- The date associated with the data.
- The total revenue on the specified date.
Chart controls
The chart provides several tools to help you customize your view.Variation selection
To show or hide a variation from the chart:- Click the dropdown menu above the chart on the left-hand side.
- Check the box next to a variation to show it, or uncheck the box to hide it.
Timescale
To adjust the timescale of the data to day, month, or year:- Click the dropdown menu above the chart.
- Select Day, Month, or Year.
Select area
To focus on a specific area of data:- Click the Select area icon.
- Click and drag over the chart to select the desired area.
- Click the checkmark to confirm your selection.
Zooming and resetting
- Click + to zoom in on the chart.
- Click - to zoom out.
- Click the Reset icon to reset your view of the chart.