

Checking when the snippet loads
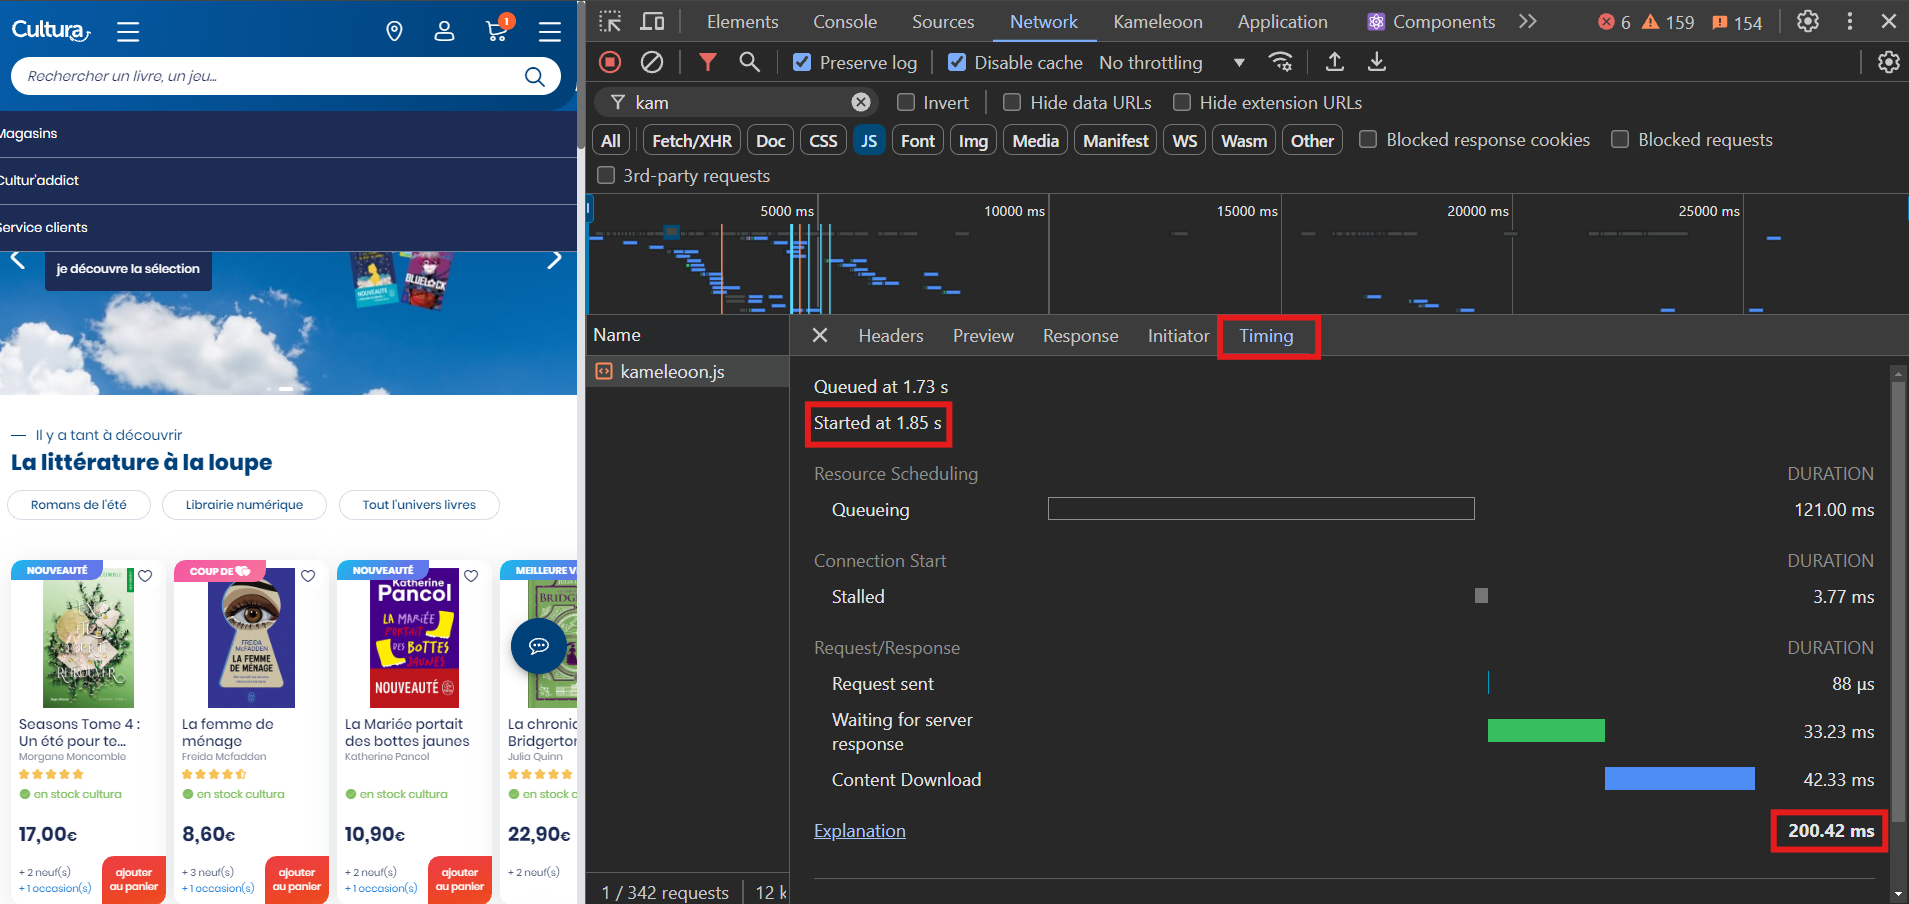
Check the timing of theengine.js (previously called kameleoon.js) tag after the page reload, as shown in the screenshot below. If the started at metric exceeds 1 second, enter the Kameleoon script higher in the <head> tag and set fetchpriority="high". These changes ensure the Kameleoon script loads in less than 1 second.
When the page first loads, the Kameleoon script takes longer, usually under 60 milliseconds, because the browser downloads it directly from the CDN. During subsequent reloads, the browser loads the script from cache.
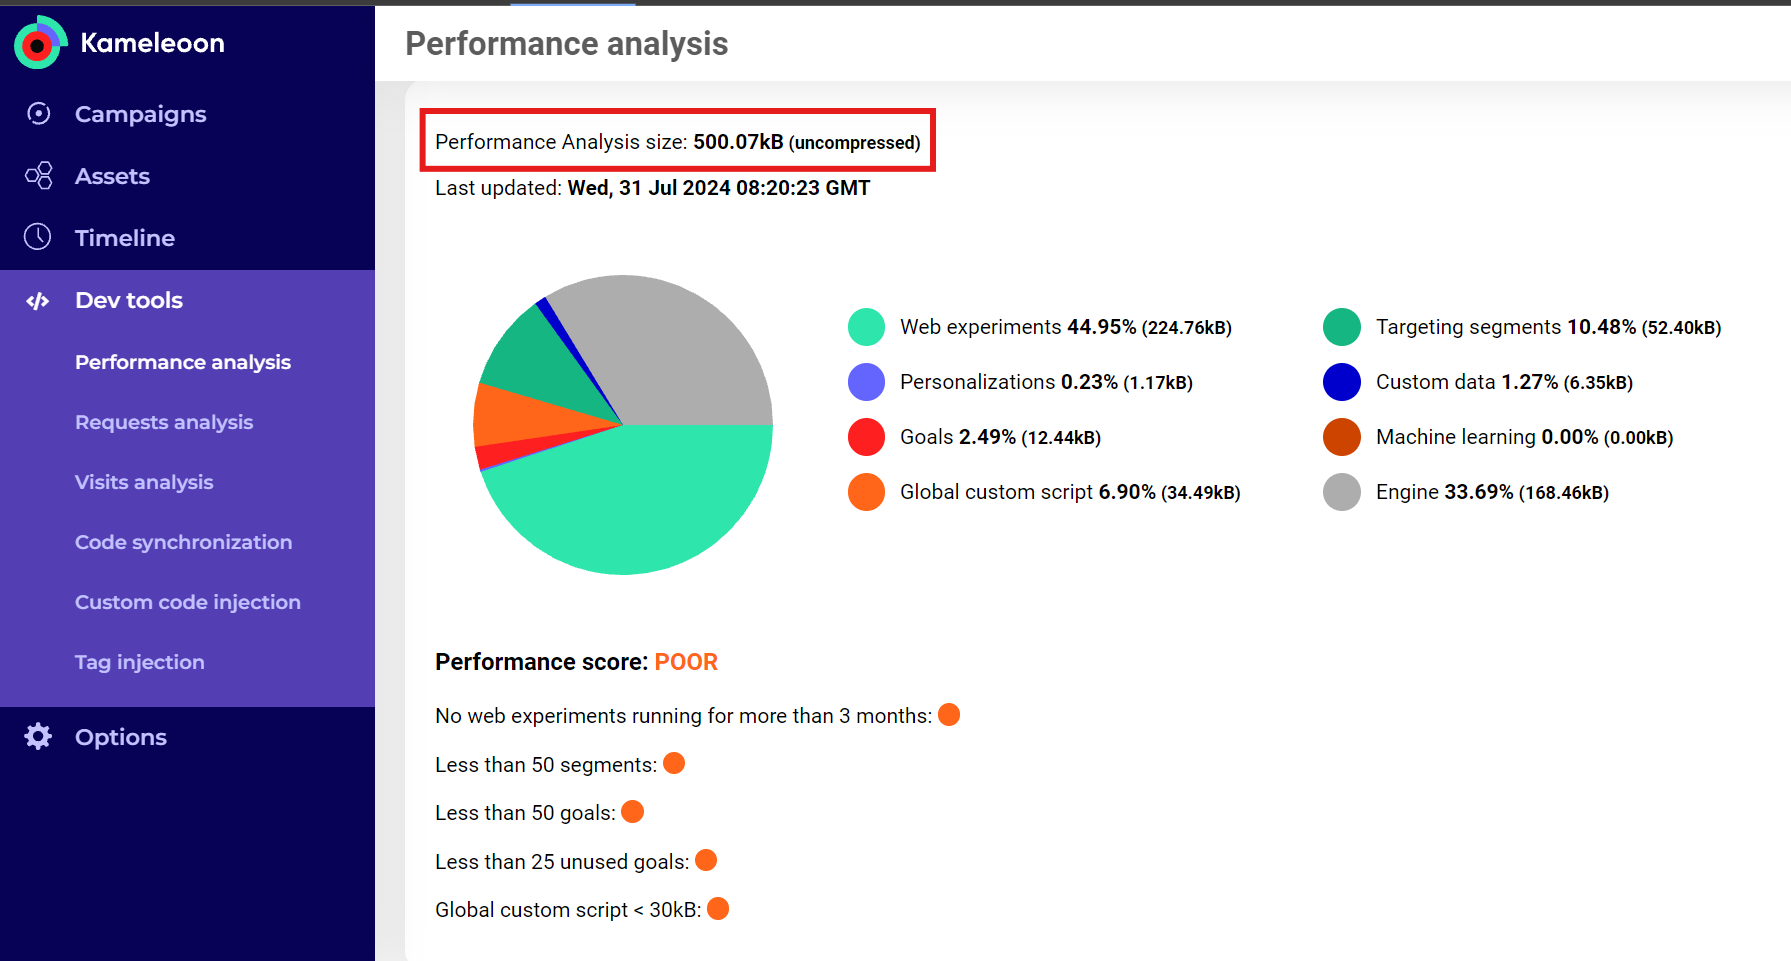
Checking performance score, powered by Kameleoon’s Chrome extension
Depending on the Performance score shown in the extension (see screenshot below), take one or all of these actions:- Stop any experiments or personalizations that have been running for more than 2 months and transfer the code to your site’s source code based on the experiment or personalization result.
- Archive any experiments or personalizations that you have stopped.
- Remove any unused goals, including their code if they’re custom goals.
- Remove any unused segments.
- Remove any unused custom data.
- Optimize the Global Custom Script to remove all unused/deprecated code.
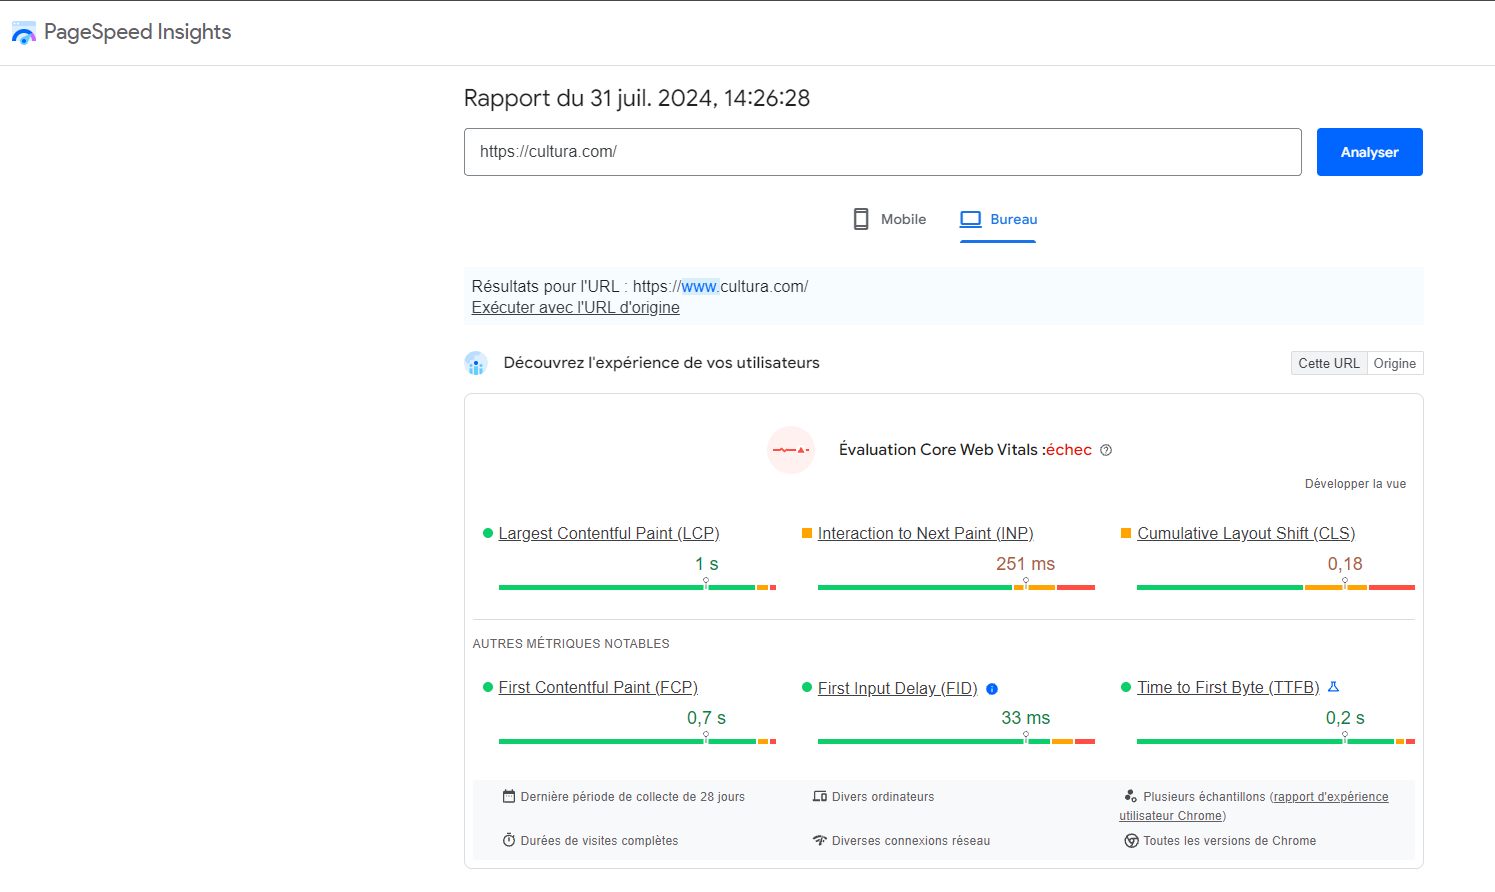
Tracking performance with PageSpeed insights
The Performance tab in the browser’s developer tools helps analyze how a web page performs by recording and visualizing key data such as page load times, memory usage, and resource consumption. It provides detailed insights into rendering, scripting, and layout processes in the form of timelines and flame charts. Reviewing these insights can help identify bottlenecks, slow-loading scripts, and other factors impacting speed. Google PageSpeed Insights analyzes the content of a webpage and provides performance insights and suggestions for improvements. It gives a score and suggestions based on Core Web Vitals, such as loading time, interactivity, and visual stability. The report presents its results with metrics like “FCP,” “LCP,” “INP,” and “CLS.”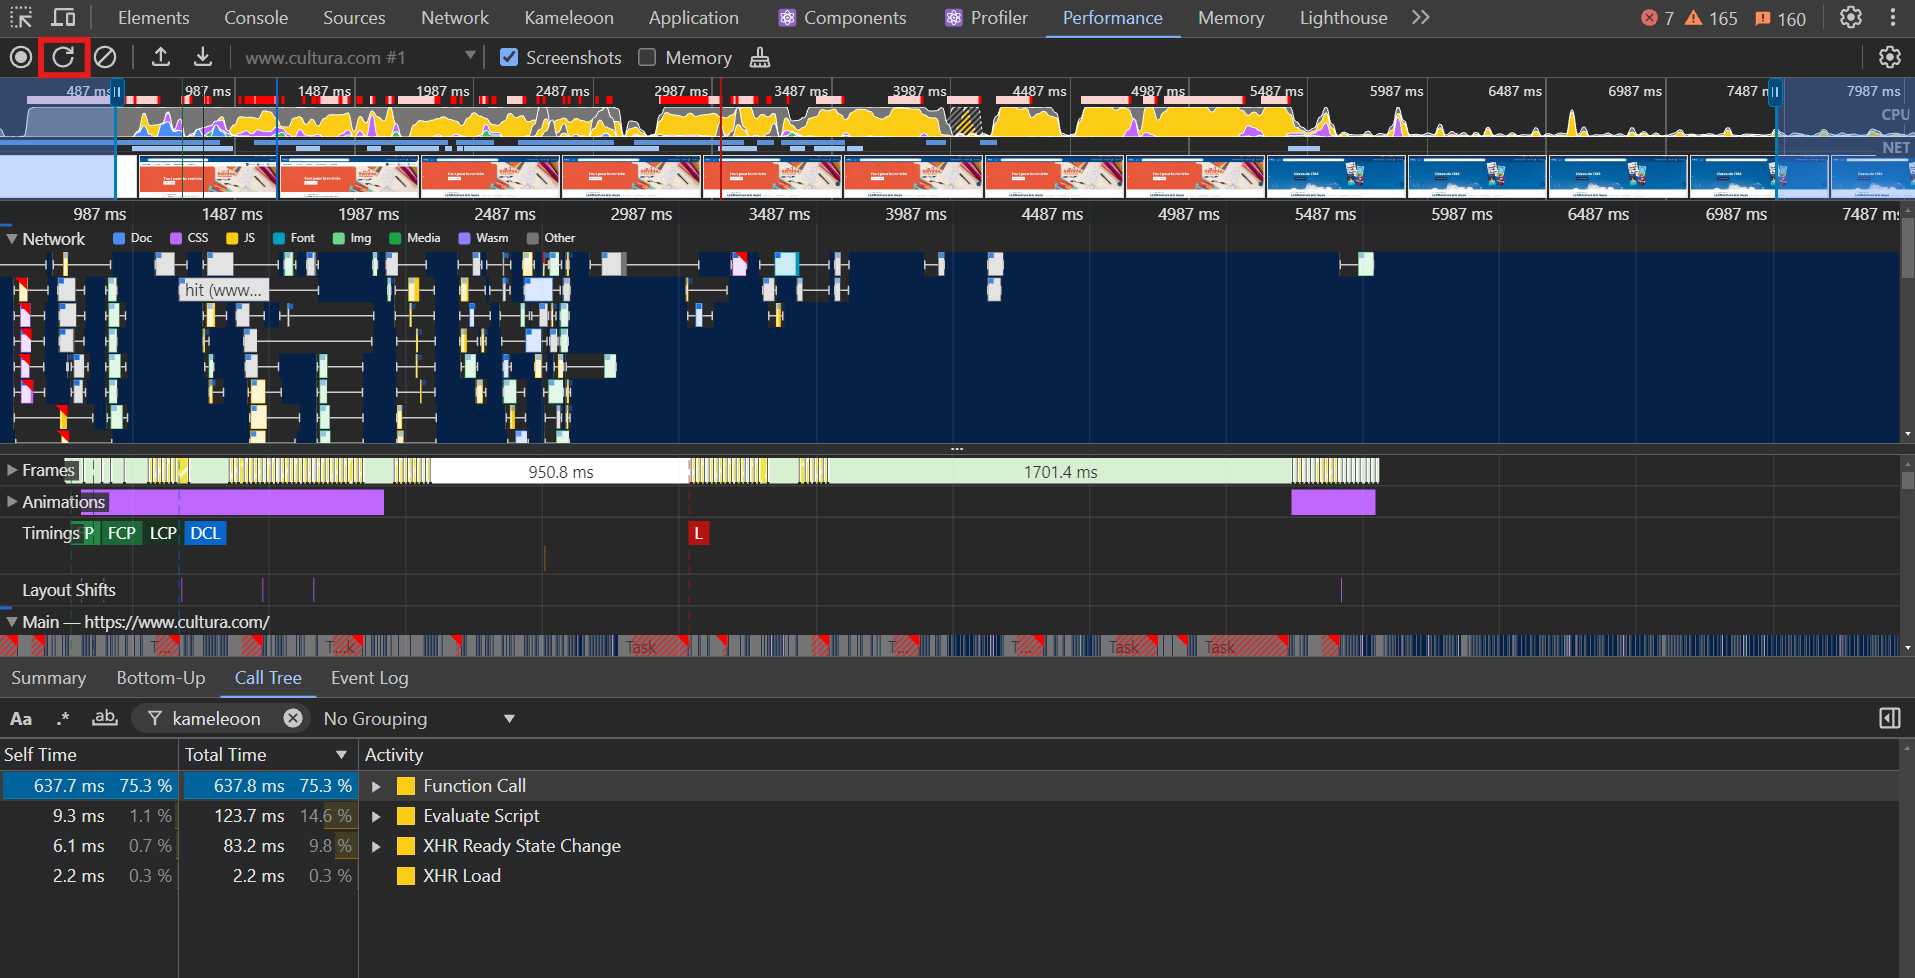
First Contentful Paint
First Contentful Paint (FCP) measures the time between the start of page loading and when the browser displays page content on the screen.- Possible impact: Anti-flicker could impact the FCP since it delays the first element display on the page
- Action: In most cases, remove the anti-flicker code and use the asynchronous tag without anti-flicker. Without anti-flicker, visitors can see the original page before a variation appears, which can reduce the accuracy of your results.
Largest Contentful Paint
Largest Contentful Paint (LCP) measures perceived loading speed. It marks the point in the page load timeline when the main content of the page has likely loaded.- Possible impact: Anti-flicker could have an impact on the LCP since it delays the display of the largest element on the page
- Action: The same as for the FCP.
Interaction to Next Paint
Interaction to Next Paint (INP) measures the page’s responsiveness. To provide a positive user experience, strive to have an INP of less than 200 milliseconds.- Possible impact: If Kameleoon loads early, there should be no negative impact. However, tests that change the behavior of an interaction might affect this metric.
- Action: You can use Kameleoon Chrome Extension or the code below in the console to check what are the experiments / personalizations that are active on the concerned page to find the possible source of the impact. The following example code snippet demonstrates how to achieve this:
Cumulative Layout Shift
Cumulative Layout Shift (CLS) measures an element’s largest change of position during the page’s lifecycle. Note that layout shifts only occur when existing elements change their starting position. If a new element enters the DOM, or if an existing element changes size, this doesn’t count as a layout change, as long as the change doesn’t result in a change to the starting position of other visible elements.- Possible impact: The Kameleoon tag has no impact on this index. experiments / personalizations on the other hand, can have a negative impact if they cause a change in the starting position of an element.
- Action: The same as for the INP.
Speed Index (ContentSquare metric)
Speed Index measures the time when the browser displays the majority of graphic elements in the initial viewport.- Possible impact: Anti-flicker could impact the Speed Index since it may delay the display of the elements in the initial viewport. Also, if you run experiments/personalizations that make changes to the top of the page, the Speed Index will be negatively impacted (it will increase).
- Actions: The same as for the FCP and INP.
Kameleoon script characteristics at a glance
- Asynchronous Snippet: Kameleoon loads its script asynchronously from a reliable CDN (Cloudflare) to ensure a non-blocking first page load and utilizes browser caching for faster subsequent page loads. Kameleoon upholds a Service Level Agreement (SLA) of over 99.99%.
Ensure you have the async attribute in Kameleoon script installed on your site. See the snippet below:
- Low script size: Kameleoon’s application file, created using TypeScript, has a size of just 29 KB (compressed with Brotli), which minimizes loading time on the first page.
- Preprocessing approach: Kameleoon generates the script only from the components necessary for your specific setup, based on the features and options you are using.
- Unique anti-flickering engine: Kameleoon’s engine captures DOM events in real-time and alters the display of components involved in an experiment variation before they’re fully rendered.
- Reduced network calls: Kameleoon groups multiple tracking events into a single beacon call, significantly decreasing the total number of network calls required.
- Single script load: Unlike other platforms that require multiple files, Kameleoon loads a single consolidated script, which reduces the number of HTTP requests.
- Deferred experiment loading: Kameleoon allows you to select which experiments to include in the application file,
engine.js(previously calledkameleoon.js) at the time of the initial page load, on a case-by-case basis, and defer non-essential experiments after the first load. - Real time update: To provide more frequent updates without browser caching getting in the way, Kameleoon’s Live Update Experiments feature refreshes any experiment labeled “LIVE-UPDATE” within a minute.
Best practices for long-term performance
Beyond analyzing performance, follow Kameleoon’s best practices to ensure sustainable and scalable experiments:- Code debt cleanup
- Coding smart
- How does Kameleoon’s platform support scability and elasticity
- Simple self-hosting and on-premises options
FAQ
Will Kameleoon's script (engine.js) slow down your website?
Will Kameleoon's script (engine.js) slow down your website?
No. Kameleoon’s script uses cutting-edge technology to run asynchronously (when using the async installation snippet) and remains fully cached by the browser for 90 minutes. It never blocks page loading, even during rare CDN incidents (99.99% uptime). On average, the script loads in under 70 ms over a 4G connection or faster network conditions.Kameleoon further minimizes impact through advanced compression techniques, combining TypeScript and Brotli, resulting in a base script size of just 28.4 KB.
CDN delivery and scalability
Theengine.js script is served via the Cloudflare CDN, which means it scales automatically regardless of your website’s traffic volume. There are no loading or slowness issues at any traffic level—Cloudflare’s global network handles delivery, so neither spikes nor sustained high traffic affect script performance for your visitors.Caching
By default, the browser cachesengine.js for 90 minutes, minimizing repeat load times for returning visitors. If your use case requires a shorter cache duration, this can be reduced—down to as little as 1 minute—on request. Contact Kameleoon support to adjust this setting for your account.Important considerations
Script size may increase depending on the number of experiments you run and their content (CSS/JavaScript).For experiments or personalization campaigns that do not need to load immediately, use the “DELAYED” tag. This delays loading non-essential experiments until after the first page load. Kameleoon intelligently manages these: it only downloads configuration after 10 seconds of idle time or when a visitor is targeted and allocated a variation other than the control. This approach ensures minimal impact on load performance while still delivering full functionality for prioritized experiments.Tracking requests and rate limits
Kameleoon batches tracking events into a single request instead of sending one request per event, which keeps the number of network calls low. For howengine.js queues and sends events, see Code flow: tracking. For how SDKs batch requests and how the Data API applies rate limits, see Rate limits.Data API rate limits
Kameleoon applies rate limits to the Data API to protect service reliability. Limits are based on your contractual Monthly Unique Visitors (MUV) and the requester’s IP address. If you exceed those limits, the API returns HTTP 429.These limits apply to all requests that reach the Data API, including the tracking calls thatengine.js sends automatically and the batched tracking requests that SDKs send. In environments where many visitors share a single IP address (such as offices or corporate networks), IP-based limits can apply even when your overall MUV stays within contract.Kameleoon automatically detects known bot traffic and excludes it from these rate limit calculations. Requests identified as coming from bots do not count towards the limits described above.For server-side integrations, you can lift IP-based limits by authenticating your requests. If your use case requires higher limits, contact Kameleoon support to discuss options.Rate limits apply to your entire customer account, not to individual projects. If one project generates excessive requests (for example, because a faulty implementation creates a loop that sends custom data events repeatedly), that project consumes the shared account limit and can cause HTTP 429 errors across all your other projects.To identify which project is generating unexpected traffic, use the Live events page (Insights > Live events). Select each project in turn and compare its event count over the past hour or 24 hours against the expected volume. A project generating far more events than its visitor volume justifies (for example, tens of millions of events against a 100,000 MUV contract) is the likely source. Filter events by type to narrow the cause: custom data events are the most common culprit, often because a misconfigured loop sends the same custom data variable, or all custom data variables, on every page load.Platform scalability
The Kameleoon platform uses horizontal scaling, auto-scaling infrastructure, load balancing, and regular load and stress testing. For more detail, see How does Kameleoon’s platform support scalability and elasticity?.Can I delay non-essential experiments until after the first page load?
Can I delay non-essential experiments until after the first page load?
Yes, you can delay non-essential experiments until after the first page load. To delay an experiment, add the
DELAYED tag to the experiments you want to defer. For more information, see the managing tags documentation.Kameleoon intelligently manages experiments tagged as “DELAYED.” It only downloads configuration after 10 seconds of idle time or when the visitor is targeted and allocated a variation other than the control. Focus on delivering the best user experience by deferring resource-intensive tests.How does Kameleoon's platform support scalability and elasticity?
How does Kameleoon's platform support scalability and elasticity?
Kameleoon’s platform provides high scalability and elasticity, ensuring optimal performance as data volumes grow. The platform handles a mean load of 20,000 queries per second with peaks up to 100,000 queries. Key factors include:
- Scalable architecture: Distributed and modular architecture allows for horizontal scaling.
- Auto-scaling infrastructure: Cloud-based infrastructure automatically scales computational resources.
- Load Balancing: Advanced techniques distribute traffic evenly across servers.
- Data ingestion and processing: Robust APIs and a data broker manage large volumes of data efficiently.
- Testing for scalability: Regular load and stress testing ensure the system handles extreme conditions.
- Elastic data storage: Multi-tiered storage allows for rapid data access and long-term scalability.