> ## Documentation Index
> Fetch the complete documentation index at: https://docs.kameleoon.com/llms.txt
> Use this file to discover all available pages before exploring further.
# Ratio Metrics
> Create goals that divide one metric by another to measure efficiency indicators like revenue per conversion or conversion rate across your experiments.
Ratio Metrics let you create goals that compare two existing metrics by dividing one by the other. This feature helps you measure relationships and efficiency indicators, such as:
* Conversion rate (Conversions / Visits)
* Revenue per conversion (Revenue / Conversions)
* Cost per result (Revenue / Conversions)
These insights give you a clearer picture of your experiment’s performance.
## Creating a Ratio Metric
You can create a Ratio Metric in the goal creation flow.
1. In the Kameleoon app, click **Settings** > **Goals** > **New goal**.
2. Select **Ratio** as the goal type.
3. Click **Next**.
4. Choose an existing goal as the numerator.
5. Choose another goal as the denominator.
6. Define the property used for calculation.
7. Click **Next** > **Create**.

Once created, the Ratio Metric behaves like any other goal in your project.
## Viewing Ratio Metrics in Results
Ratio Metrics are fully integrated into the Results page. They display consistently across tables and charts, whether you are viewing by goal or variation.
### In Results tables
* A dedicated **Ratio Value** column shows your metric (changes from **Conversion Rate**).
* Kameleoon displays values with the correct decimal precision.
* When applicable, Kameleoon hides revenue columns for clarity.
### With filters and breakdowns
* Applying filters automatically recalculates Ratio Metrics based on the filtered set of visits.
* You can break down Ratio Metrics by attributes (device or location, for example) to compare efficiency across segments.
## Exporting Ratio Metrics
Both **XLSX** and **raw data exports** include Ratio Metrics, so you can continue your analysis outside Kameleoon.
## Additional features
* **Hover tooltips:** When you hover over a Ratio Metric's name, you'll see its formula and component metrics.
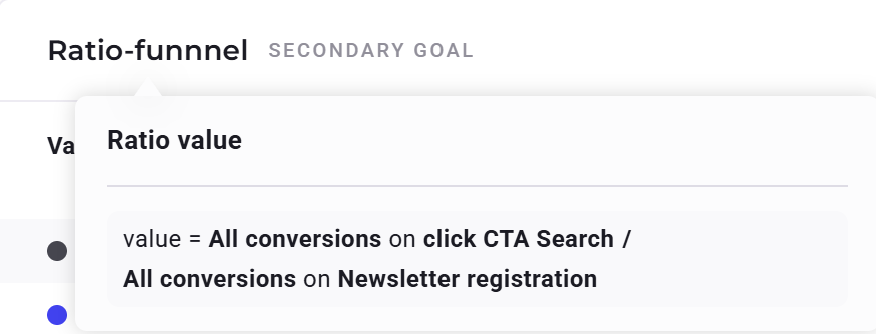 * **Reliability charts:** You can view cumulated reliability charts for Ratio Metrics when you select them as main or secondary goals.
## Example use cases
* **Marketing efficiency:** Compare campaign conversions per visit.
* **Revenue insights:** Track average revenue per user or conversion.
* **Optimization impact:** Measure whether changes at one step of the user journey (for example, increasing visits or conversions on Goal A) affect the efficiency of another outcome (for example, revenue from Goal B).
* **Reliability charts:** You can view cumulated reliability charts for Ratio Metrics when you select them as main or secondary goals.
## Example use cases
* **Marketing efficiency:** Compare campaign conversions per visit.
* **Revenue insights:** Track average revenue per user or conversion.
* **Optimization impact:** Measure whether changes at one step of the user journey (for example, increasing visits or conversions on Goal A) affect the efficiency of another outcome (for example, revenue from Goal B).